
 Cloud & AI Infrastructure
 Dev Ops Live
 Cyber Security World
 Big Data & AI World
 Data Centre World
Exhibitor Products
Motadata ObserveOps
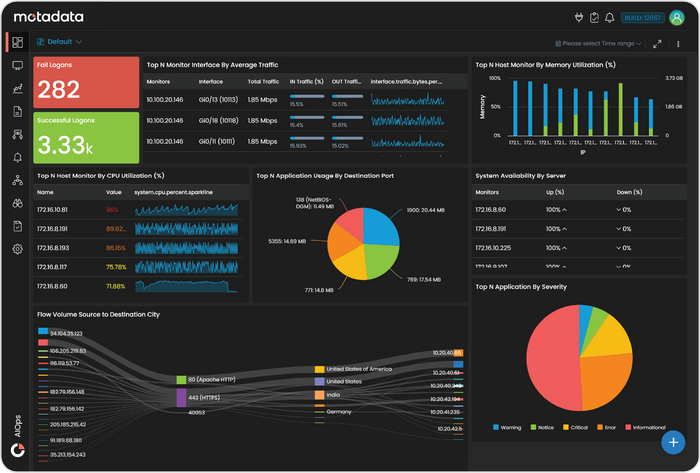
Motadata ObserveOps gives IT and NOC teams one platform for everything they monitor. Metrics, logs, flows, traces, and topology all arrive in the same system, so you stop moving between a network tool, a log tool, and an APM tool to answer a single question. It runs across on-premises, private cloud, public cloud, and hybrid environments.
What You Can Monitor
ObserveOps covers nine infrastructure types. Those are servers and applications, network devices, cloud services (AWS, Azure, Office 365), virtualisation (VMware, Hyper-V, Citrix), hyperconverged infrastructure, business services, processes, network interfaces, and service checks such as ping, port, URL, DNS, and SSL certificate expiry.
The Modules
- Log Explorer: dynamic parsing with built-in parsers, live tail, surrounding logs for context on any single event, and machine learning pattern matching.
- Flow analysis: NetFlow, sFlow, jFlow, and IPFIX, with Sankey visualisation to trace conversations and find the users taking the most bandwidth.
- Application performance monitoring: end-to-end traces broken into spans, with flame charts, for Java, .NET, PHP, Node.js, Python, Go, and Kubernetes.
- Real user monitoring: front-end experience measured through LCP, FCP, CLS, INP, and Apdex, sliced by browser, device, and geography.
- Network configuration and compliance: configuration backup, version tracking, change detection, bulk execution, and compliance assessment against CIS, GDPR, HIPAA, and SOX.
- Service level objectives: availability and performance targets, with correction profiles for maintenance windows and penalty profiles for contractual impact.
Where the AI Sits
ObserveOps runs two kinds of alert policy. Basic policies fire on fixed thresholds. AI and ML policies handle anomaly detection, dynamic baselines, root cause analysis, and capacity planning, and they run across every signal the platform ingests.
The correlation engine underneath maps dependencies across domains, so related alerts group into one picture instead of arriving separately.
How It Deploys
Six deployment modes are supported: single-box, distributed, multi-site with collectors at remote branches, high availability, disaster recovery, and high availability over WAN. That range suits regulated industries and organisations spread across many sites.
The Current Edition
ObserveOps Infinity has been the shipping edition since August 2026. It replaces four earlier editions with one, so monitoring, topology, SLO, dashboards, AI and ML capability, automation, and the observability pipeline all unlock on day one.
Two changes matter for cost. Log and flow licensing moved from per GB per day to per source, so a chatty application no longer changes what you pay. And an equivalent deployment now runs on up to 30 to 40 percent less hardware, a range we publish as indicative because it moves with device mix, retention, and topology.
Working With ServiceOps
ObserveOps integrates natively with Motadata ServiceOps. An alert can open a ticket with the affected configuration item, site, owner, and service already attached, which closes the loop from detection through to resolution.
See ObserveOps Infinity in action: https://www.motadata.com/products/observeops-infinity